The table below shows the result of the algorithm for three different inputs, corresponding to three audio signals.
Each time, we compute the wavelet transform of the signal (with 15 Cauchy wavelets of order 5). We add 1% of gaussian white noise to the modulus and try to reconstruct the initial function with our algorithm.
At the end, we measure the modulus error (that is the relative difference between the wavelet transforms, in modulus, of the original and reconstructed functions) and the function error (the relative difference between the original function and its reconstruction).
The algorithm performs correctly in the sense that the modulus error is small. However, the function error is large.
By ear, the three signals are almost undistinguishable from their reconstructions.
Original
Reconstruction
Modulus error
Function error
Voice
Visualization of the instabilities of the reconstruction
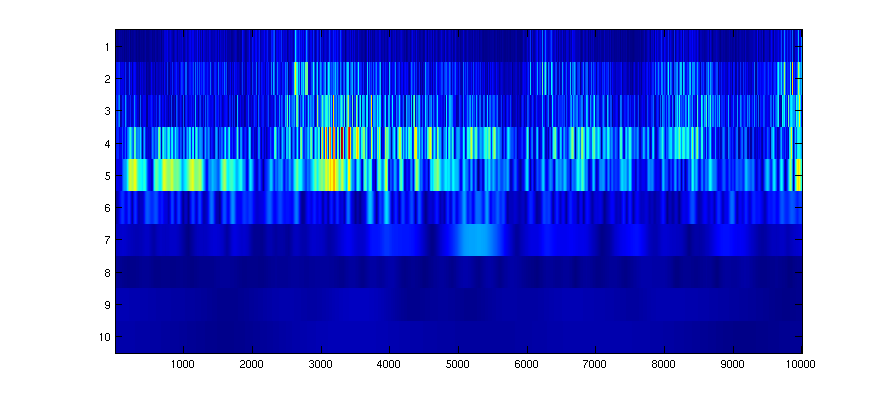
The figures 1 and 2 below show the modulus of the wavelet transform of the third signal of the previous paragraph and the modulus of the wavelet transform of its reconstruction.
The x-axis represents the time and the y-axis represents the frequency index j ; the highest frequencies are on top. The five components of lowest frequencies are not displayed: there are negligible in front of the other ones. The wavelet transforms are also truncated in time: only a period corresponding to approximately one second of music is displayed.
The initial and reconstructed modulus are almost identical.
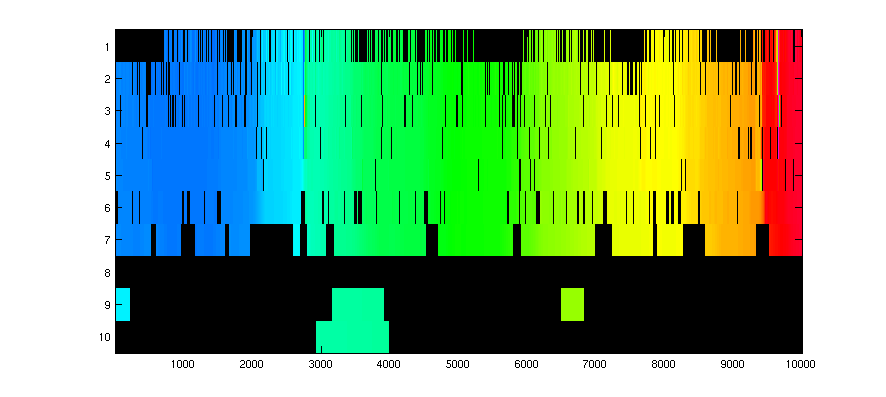
The figure 3 shows the difference in phase between the initial and the reconstructed wavelet transform.
The colormap is circular. Phases around 1 are plotted in cyan and phases around -1 are plotted in red. The black points correspond to places where the wavelet transform is less than one percent of its maximal value; at these points, the phases are not significant.
The difference in phase varies slowly both in time and frequency. One can check that the sharper variations occur at points where the modulus of the wavelet transform is small.
Figure 1 : modulus of the wavelet transform of the original signal
Figure 2 : modulus of the wavelet transform of the reconstructed signal
Figure 3 : difference in phase between initial and reconstructed wavelet transforms